
The recent rains of 15 & 16 January have brought a welcome relief to our area. Moreover, Bitou Municipality has informed that following the introduction of Level IV restrictions water consumption has dropped to “a groundbreaking low of 10,4 Ml/day on 17 January” and that “(this) achievement reflects the community’s commitment to saving water and shows the power of collective action.” A water-saving awareness campaign is now under way in some of our communities, notably New Horizons, Kwanokothula and Kranshoek.
At the same time municipality emphasises that our water crisis is far from resolved: “Supply levels remain under pressure: Keurbooms River flow is steady at 1020 L/s and Roodefontein Dam sits at 32,17%, underscoring the need for continued restraint.”
But hasn’t our main water source – the Keurbooms River – bounced back? Isn’t a steady flow of 1020 L/s more than enough considering that the limit for water extraction is less than a third of that (300 L/s)?
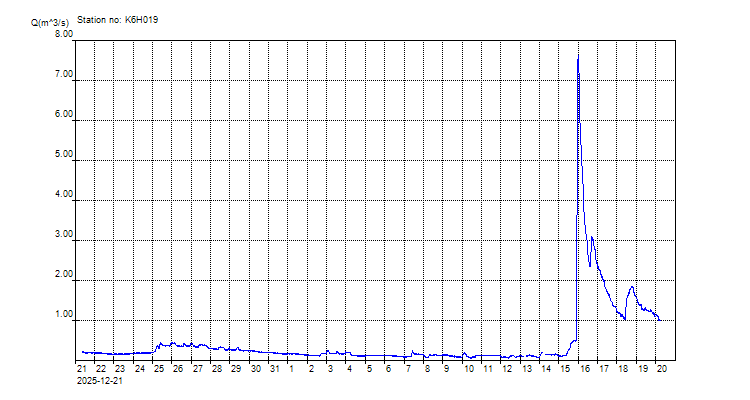
No: for unless we have regular rainfall over the next month or two the flow rate might soon be back in the critical zone. Yes, we can be proud of our 56% reduction of water consumption over 17 days (from an all-time high of 18.5 on 1 Jan to 10.4 Million Liters/day on 17 Jan). But then this drop is by far outperformed by the upward spike in the Keurbooms flow rate: On 12 January it stood at a meagre 51 Liters/second; four days later on 16 January it peaked at 00:36 with 7.618 Liters/second. That’s a 149 fold increase, or to put it in percentages: 14,937.26 %. Nature wins.
Indeed, this dramatic increase in the Keurbooms flow rate was to be expected – and what’s cause for concern is that it will in all likelihood all too soon swing back into the opposite direction. Surface run-off in the catchment is strong after a heavy rain; sub-surface storage of water however is significantly reduced because thirsty alien vegetation has taken over. That’s one of the reasons why the positive effect of an occasional rainfall will only be of a temporary nature.
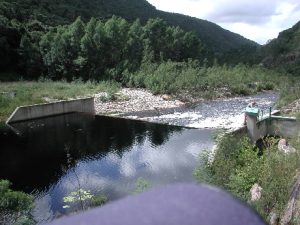
Just how dramatic the upward and downward spikes in the Keurboom Ribever’s flow rate are is best illustrated by this graph, which is taken from the Department of Water and Sanitation’s website. The DWS website shows in real-time the current flow rate of rivers in South Africa’s major catchment areas. And this is how the Keurbooms’ flow rate developed over the past three weeks:
In case you want to monitor our river’s flow rate here is the link to the relevant section of the DWS website. The simple truth remains this: unless more water runs into the river upstream, less will arrive at the bottom. Less rain, a steady increase in invasive alien vegetation in the catchment area coupled with an increase in water extracted – before or at the weir and the municipal pump station make for a “perfect storm”. Unfortunately a rather dry one.